Sort categories intentionally
Order bars by value or in a logical sequence so comparisons are effortless. Avoid random ordering which forces your audience to work harder.
🎉 New AI Code Agent for Jupyter Notebooks is now available! Download for free
Transform tables into beautiful bar charts in moments. Upload your data, configure the layout, and export presentation-ready visuals without writing code.
Ideal for summarizing rankings, category performance, and survey responses.
Build your first chart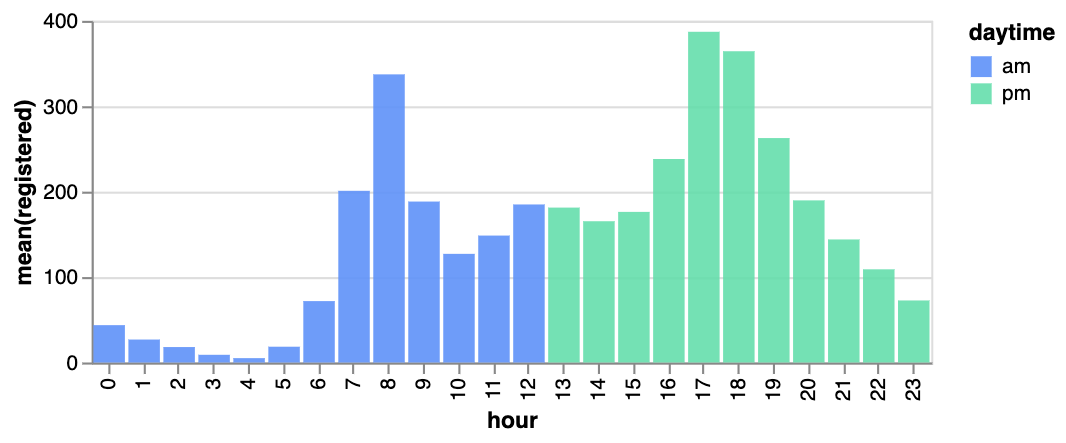
Follow these tips to keep your comparisons easy to read and trustworthy.
Order bars by value or in a logical sequence so comparisons are effortless. Avoid random ordering which forces your audience to work harder.
Use one primary color plus an accent highlight. Too many colors distract from the relative sizes that make bar charts effective.
Add clear axis titles, specify units, and consider direct data labels for crucial values to eliminate guesswork.
Craft a polished chart in three guided steps.
Start from a sample dataset or paste your own labels and values into the table.
Choose horizontal or vertical layout, adjust colors, spacing, sorting, and add annotations for emphasis.
Download the finished chart as a PNG or copy the Vega-Lite JSON to embed anywhere you publish insights.
Everything you need to know before sharing your chart.
Yes. Upload CSV or TSV files or paste values directly into the data table. The tool maps fields automatically so you can adjust them quickly.
The bar chart maker comfortably handles dozens of categories. For long lists, group similar items or enable sorting to keep the chart legible.
Download high-resolution PNG images or copy the Vega-Lite specification to embed the chart elsewhere with your preferred framework.
The bar chart maker runs completely in the browser and is free to try. Sign in to unlock saved projects and AI enhancements.
Discover additional vizGPT chart builders to keep refining your visuals.

