Show consistent intervals
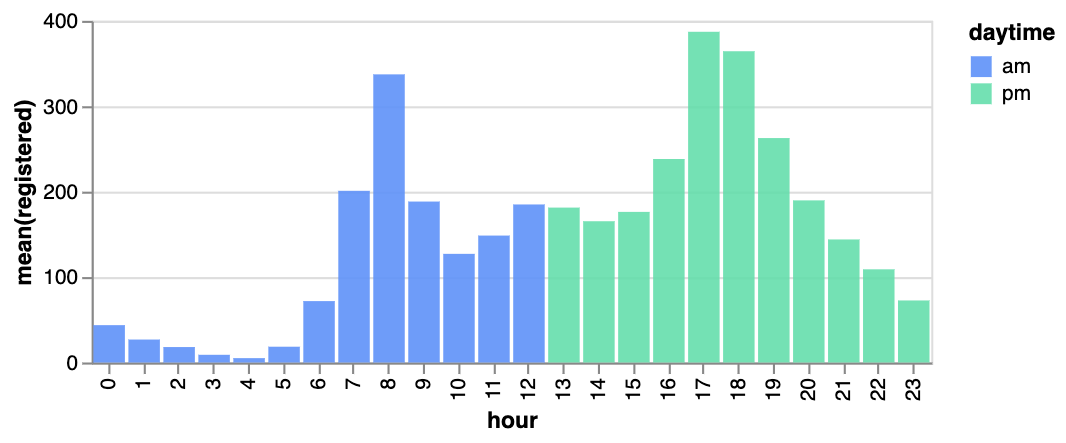
Keep the x-axis spacing true to your time or category intervals. Avoid irregular spacing that could mislead readers.
🎉 New AI Code Agent for Jupyter Notebooks is now available! Download for free
Visualize change over time in a few clicks. Upload your dataset, compare series, and present a clean, on-brand trend line in minutes.
Ideal for KPI dashboards, growth reports, finance updates, and product analytics.
Create your chart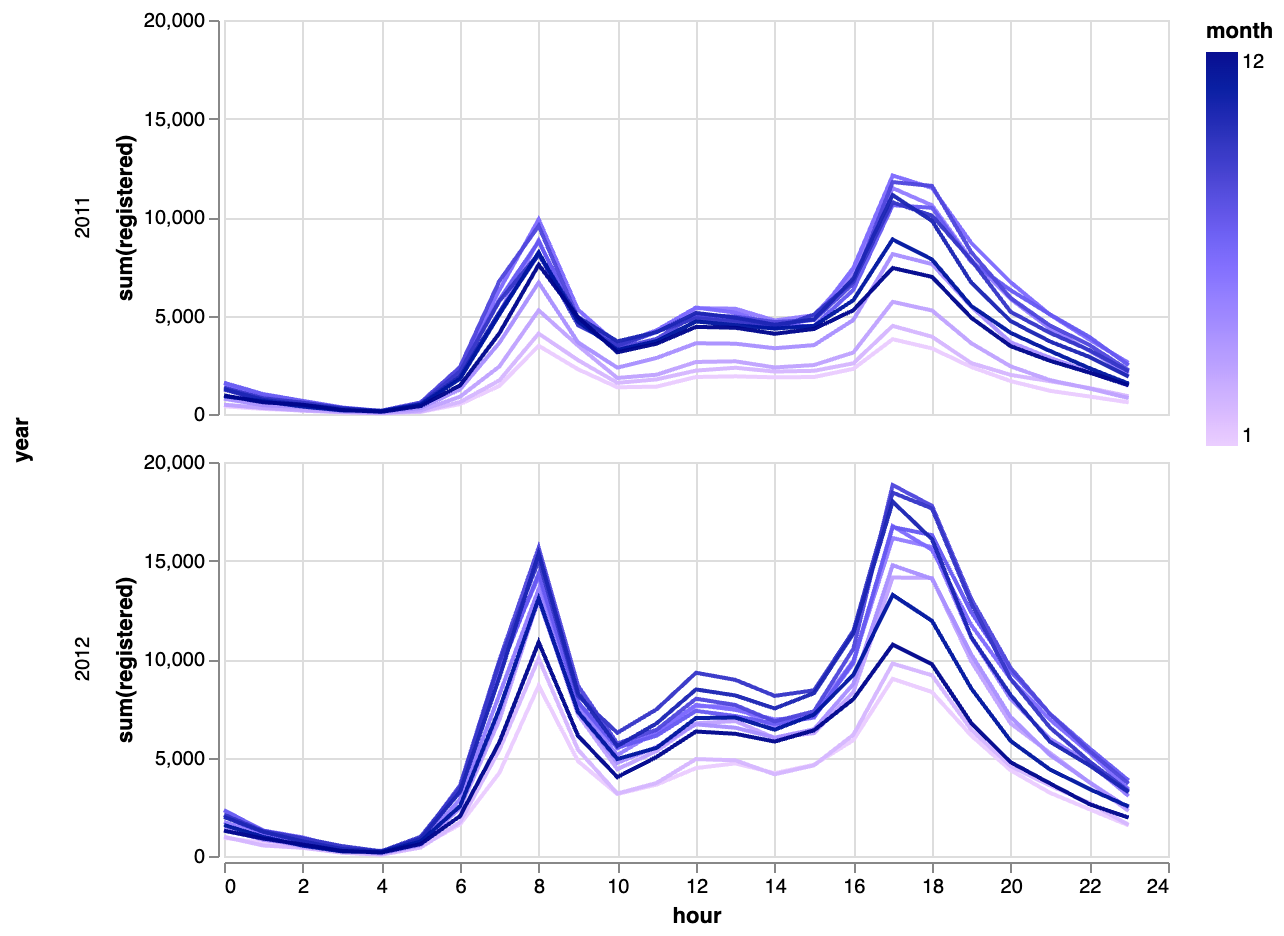
Keep your timelines accurate, readable, and persuasive.
Keep the x-axis spacing true to your time or category intervals. Avoid irregular spacing that could mislead readers.
Plot only the most relevant lines or group minor categories to maintain readability. Too many series makes trends hard to follow.
Add markers or callouts for peaks, dips, or milestones so your audience knows what matters most in the timeline.
Three simple steps to communicate momentum.
Import a CSV or enter labels and values for each period you want to track.
Adjust colors, markers, smoothing, and axis labels to match your story and brand.
Download a ready-to-present graphic or copy the Vega-Lite spec to embed your chart in dashboards.
Answers to common questions before you publish.
Enter your labels and values in the form, upload a CSV, or start from a sample dataset. The preview updates instantly as you edit.
Yes. Add additional columns or series in the data table to compare multiple lines on the same chart and customize the colors for clarity.
Use the export menu to download a high-resolution PNG or copy the Vega-Lite JSON spec to embed your chart in other tools.
VizGPT offers a free tier with 5 AI queries per day so you can build charts without paying or installing software.
Try additional vizGPT builders for every type of chart.

