Label axes with units
Give each axis a descriptive title and include measurement units so relationships are instantly clear.
🎉 New AI Code Agent for Jupyter Notebooks is now available! Download for free
Plot relationships between variables in seconds. Upload your dataset, choose encodings, and export interactive charts without leaving your browser.
Use it for marketing funnels, financial metrics, scientific data, or any paired measurements.
Start free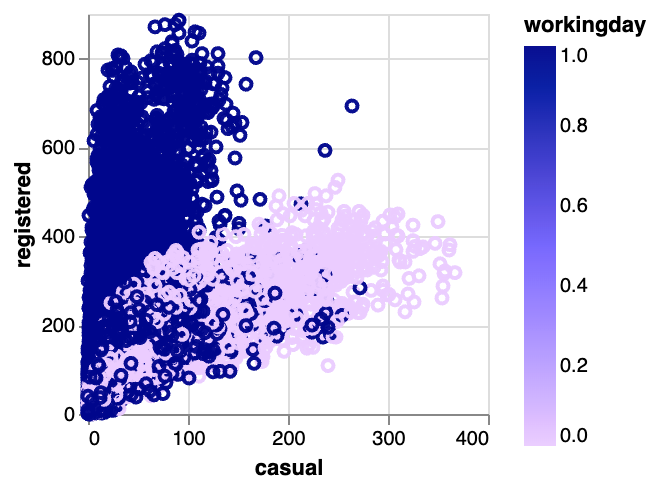
Keep your relationship analysis crisp, accurate, and actionable.
Give each axis a descriptive title and include measurement units so relationships are instantly clear.
Keep aspect ratios balanced and avoid truncated axes unless you call out the break with annotations.
Adjust opacity, enable jitter, or aggregate dense clusters so every point remains interpretable.
Three steps from raw data to ready-to-present insights.
Start with a template dataset or upload your own CSV to map numeric fields to the horizontal and vertical axes.
Choose colors, point sizes, tooltips, and trend lines that make the relationship between variables obvious.
Export a high-resolution image or copy the Vega-Lite spec to embed the interactive chart anywhere.
See how teams rely on scatter plots to uncover relationships.
Answers to the most common scatter plot questions.
Yes. Use the import option to load CSV files or paste tabular data directly into the editor.
Enable log scales or normalize your data within the tool to keep all points visible and comparable.
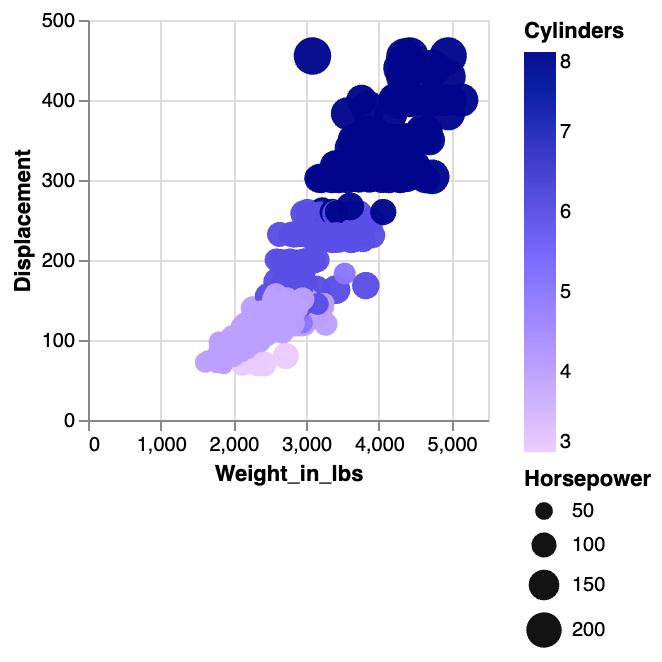
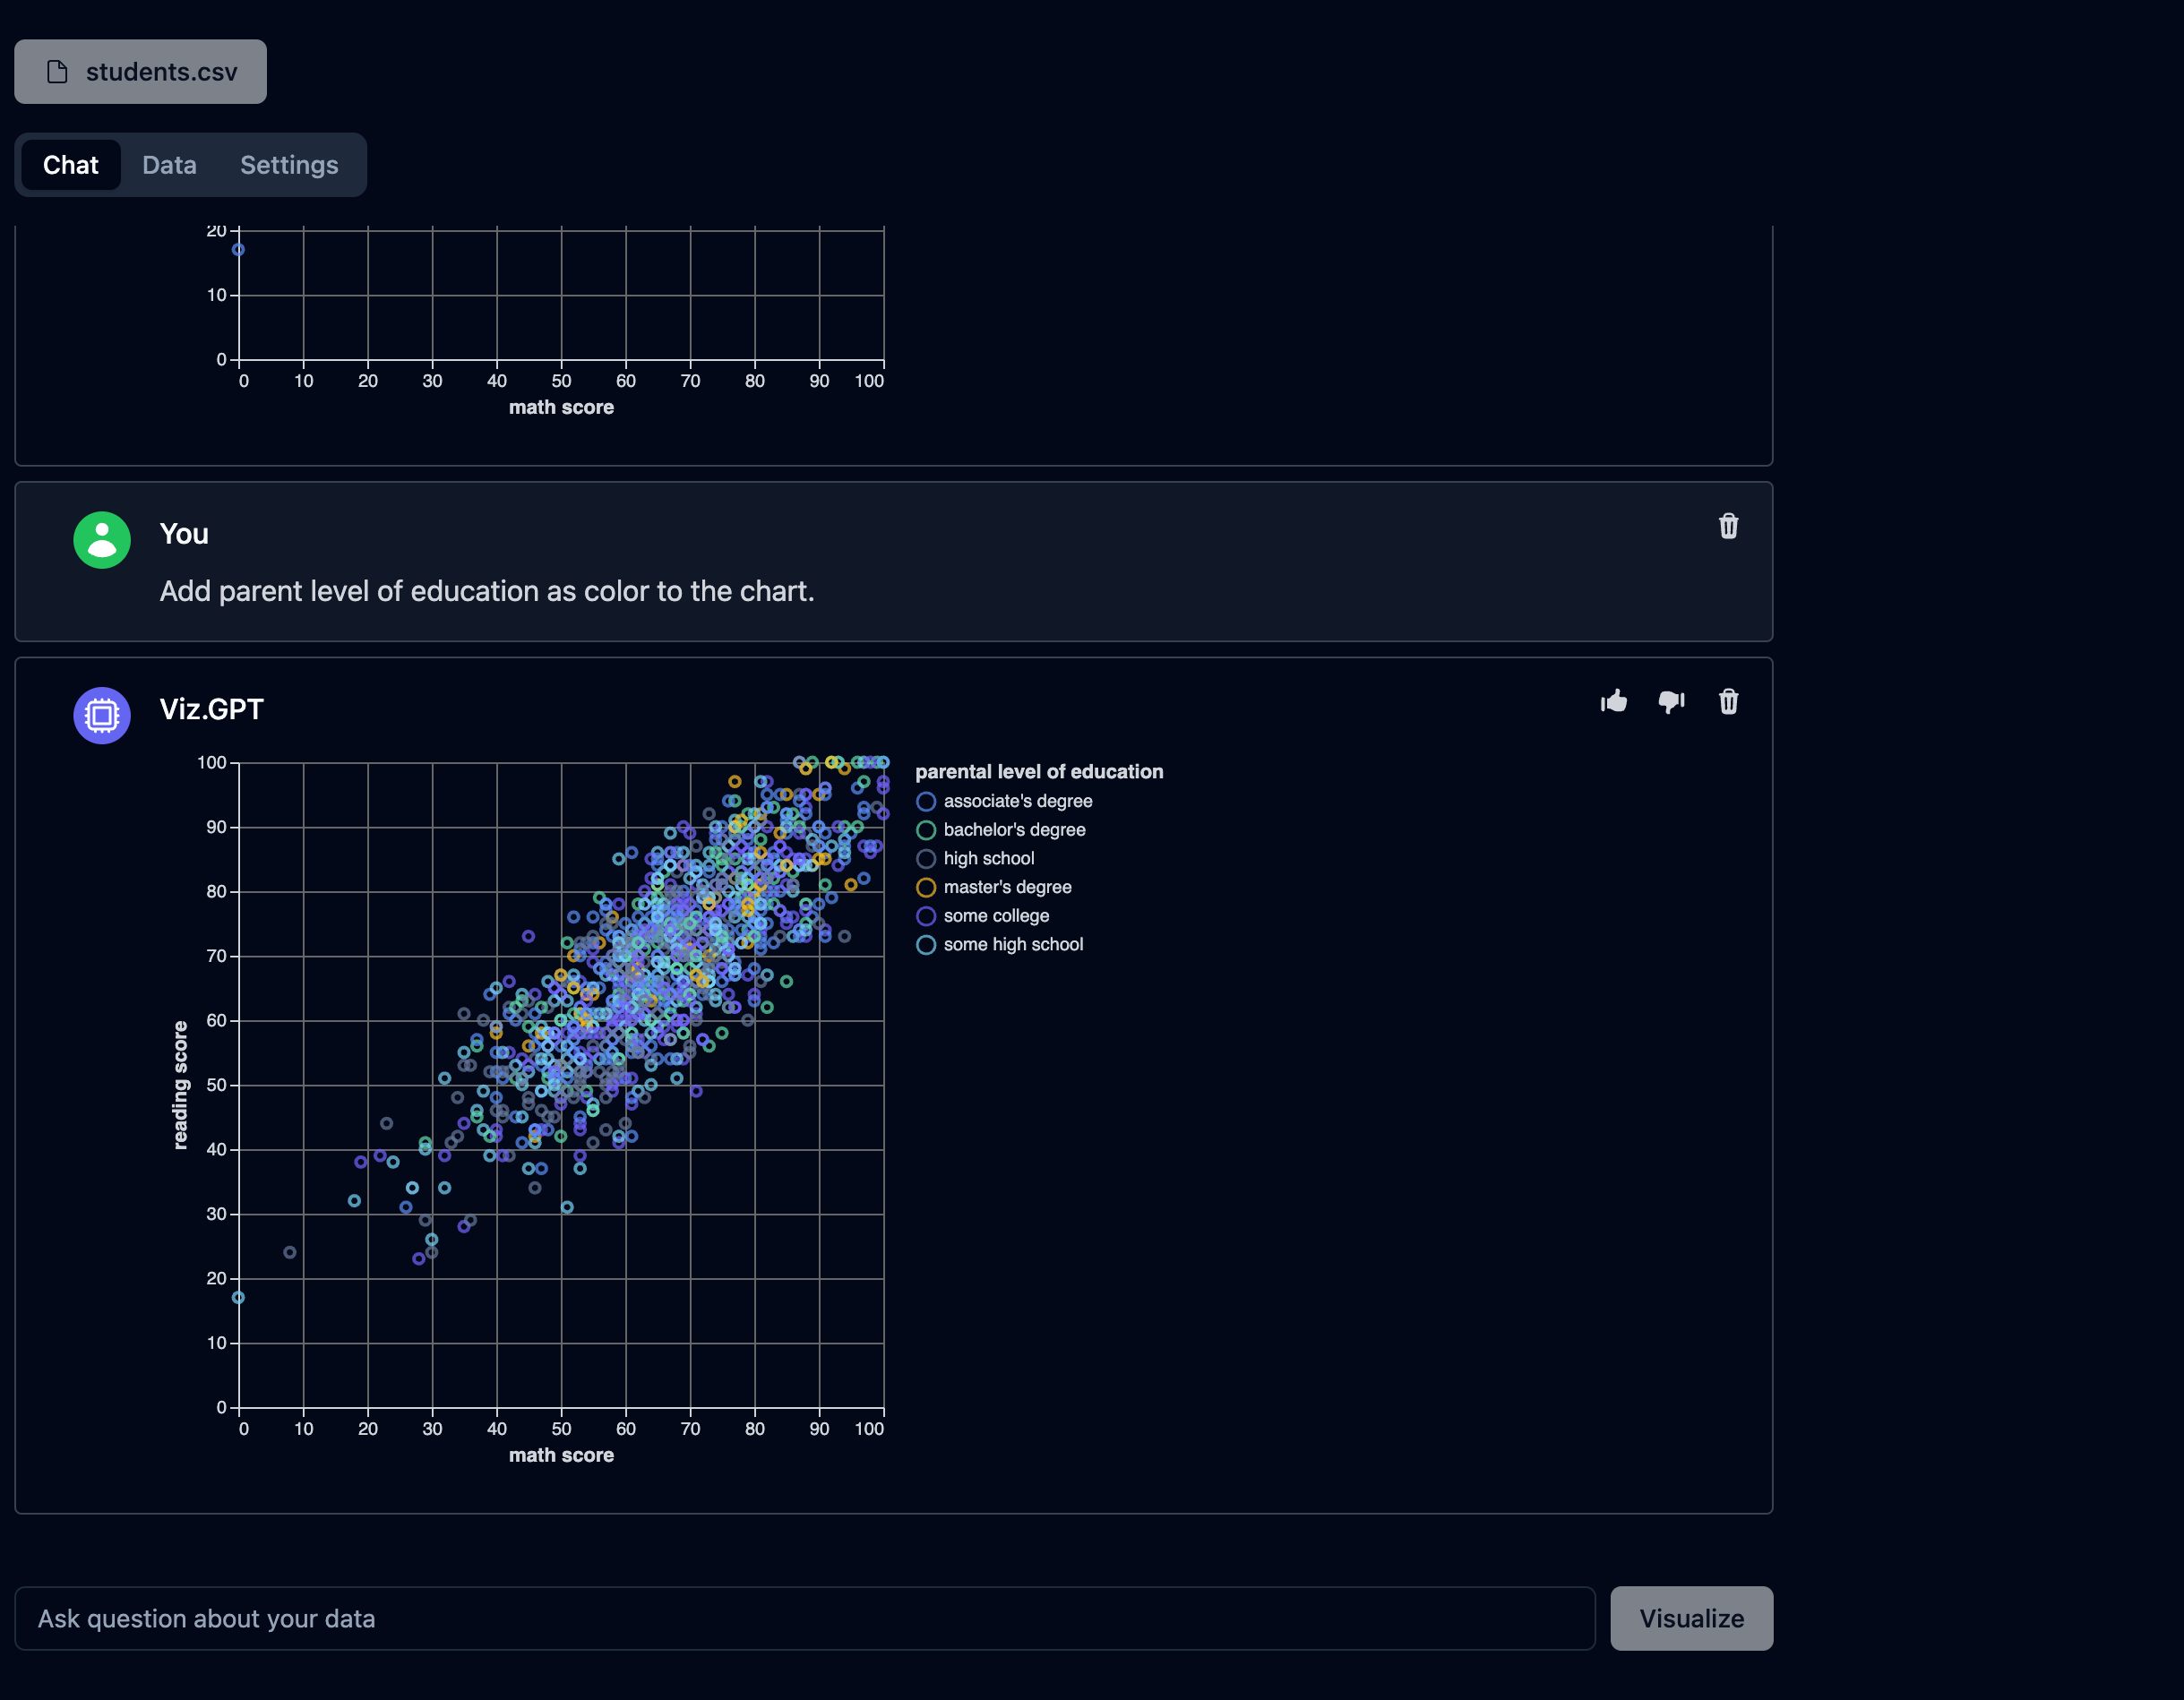
Use color or size encodings for a third variable, add annotations, or filter down to a subset of points to focus your story.
VizGPT offers a free tier with 5 AI queries per day and unlimited manual editing.
Create your own scatter plot now.
Sign up free – 5 AI queries/dayExplore more vizGPT chart builders tailored to different datasets.

