Limit bubble categories
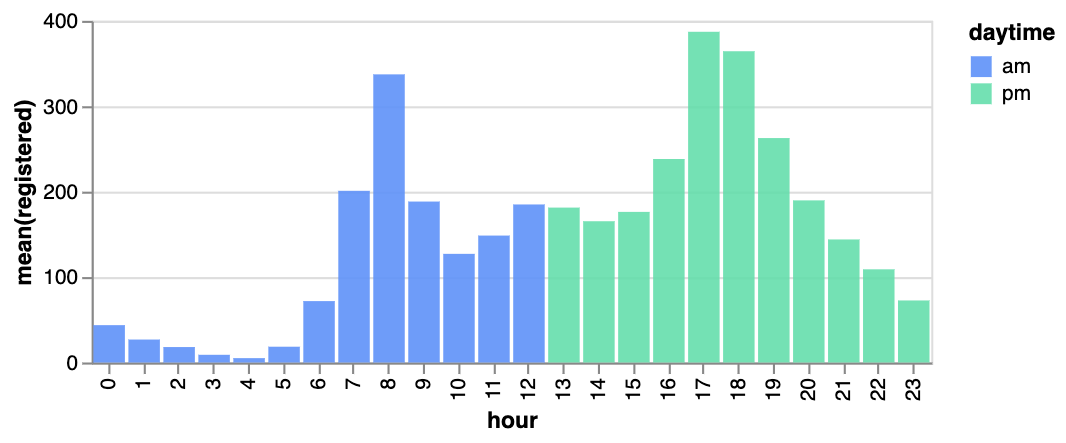
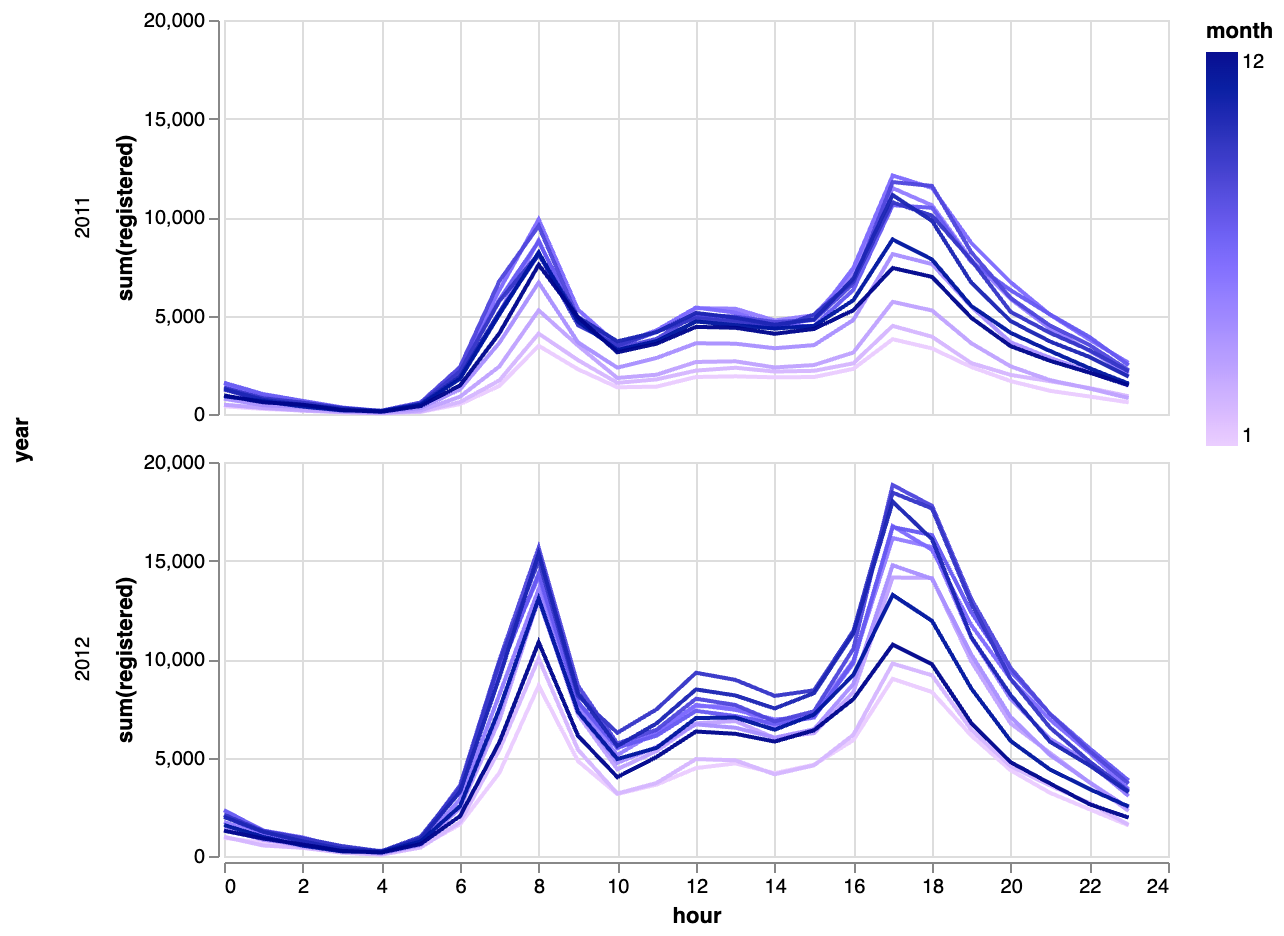
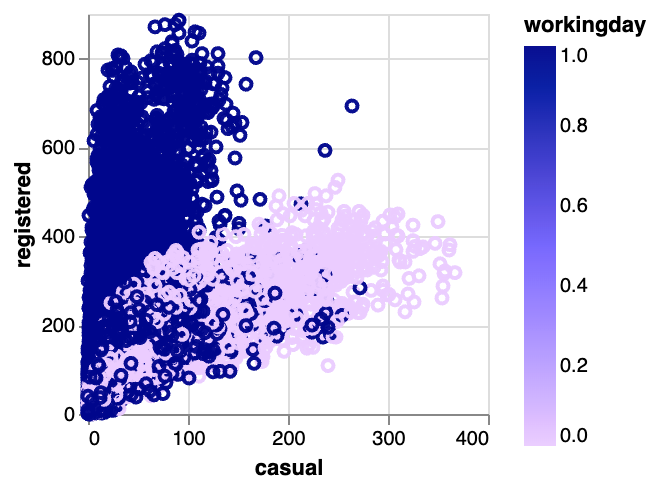
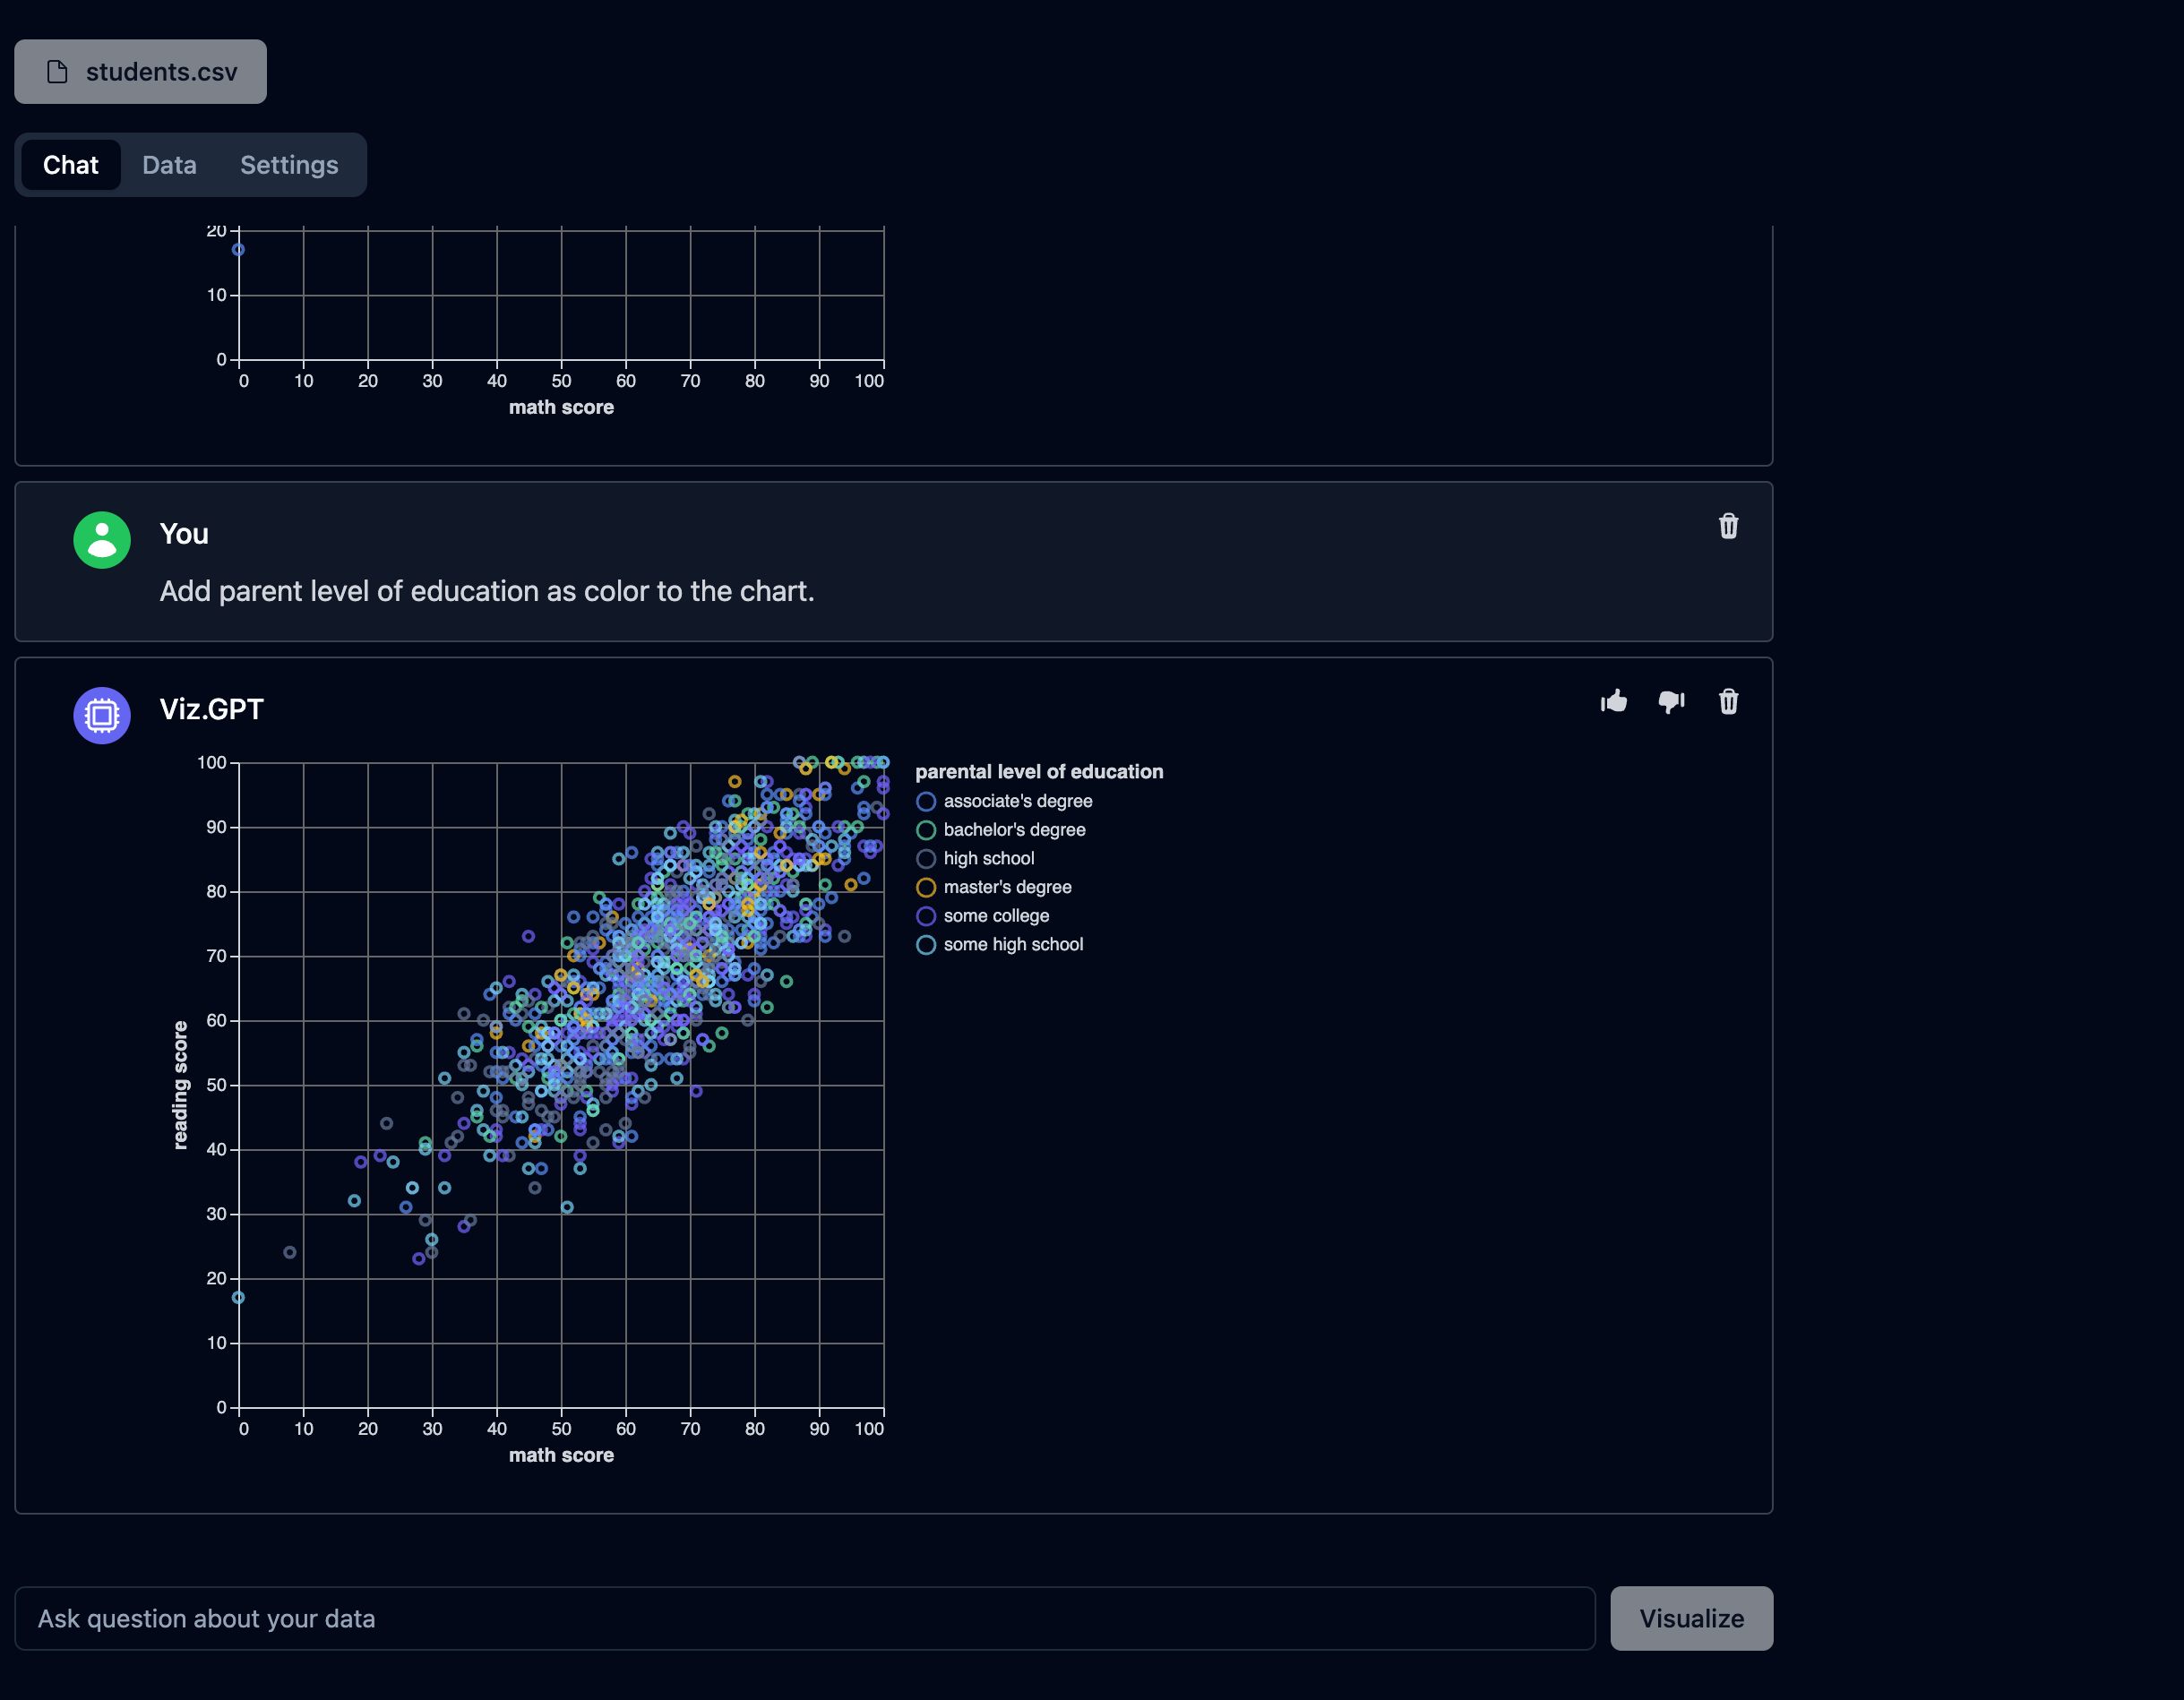
Use color to distinguish a handful of groups. More than six categories can make the legend and chart difficult to read.
🎉 New AI Code Agent for Jupyter Notebooks is now available! Download for free
Compare performance across three dimensions at once. Upload your data, map axes and bubble sizes, and customize the styling for crystal-clear insights.
Great for portfolio analysis, marketing funnels, product metrics, and lab experiments.
Launch the tool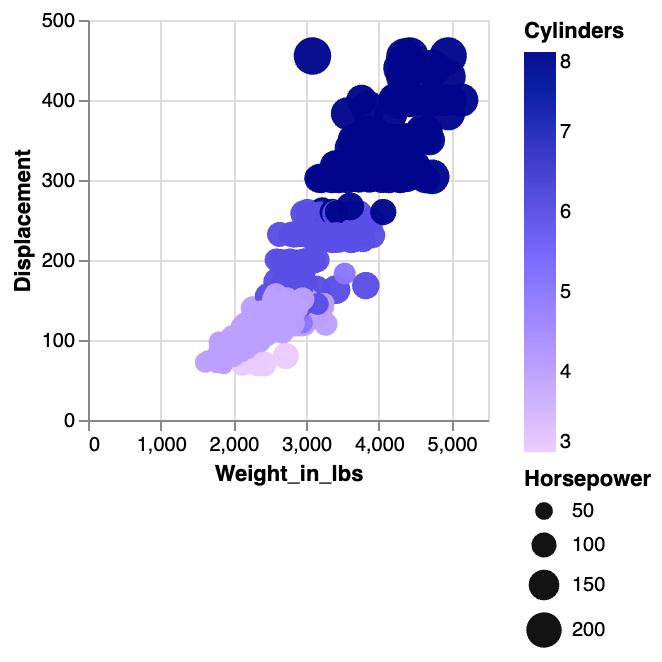
Design expressive scatter-bubble visuals that remain easy to read.
Use color to distinguish a handful of groups. More than six categories can make the legend and chart difficult to read.
Human perception of area is nonlinear. Use square-root scaling so large bubbles do not overwhelm the chart.
Add gridlines or annotations so viewers understand the context for each axis and bubble size.
Move from spreadsheet to shareable chart in three steps.
Upload a CSV or paste data so each column maps to a bubble position or dimension.
Assign colors, adjust bubble scaling, add labels, and set tooltips to highlight your story.
Download a high-resolution image or copy the Vega-Lite spec to share interactive charts anywhere.
Answers to popular questions about mapping and exporting bubble charts.
Bubble charts shine when you have at least three quantitative fields—X, Y, and size—plus an optional category for color. Marketing pipelines, investment portfolios, and scientific comparisons are popular fits.
Use the size slider to scale bubbles proportionally, enable jitter for similar values, or group categories with filters so important points stay visible.
Yes. Upload a CSV or paste values to instantly generate a chart that you can customize and export. The tool maps the fields automatically.
Download a crisp PNG or reuse the Vega-Lite specification to embed the interactive bubble chart in your own applications.
Ready to create your own bubble charts?
Sign up free – 5 AI queries/dayKeep exploring vizGPT chart tools for every dataset.

